Longer passenger trips despite declining passenger counts
Steer researched 10 years of data from the National Transit Database to find that transit riders are taking longer trips.
While the U.S. transit industry has been experiencing a ridership decline, Steer researched 10 years of data from the National Transit Database (NTD) to find that current transit riders are typically taking longer trips. This change presents transit systems with an opportunity to redefine their services to better meet their market strengths.
We analyzed the unlinked passenger trip (passengers) and passenger mile data from the National Transit Database for report years 2008 through 2017. While the Federal Transit Administration (FTA) has reviewed trends over a five-year period, we wanted to capture the period before the oncoming of new disruptive transportation services marked by the start of Uber in 2009. We limited our analysis to the 368 transit agencies and their respective modes that reported passenger and passenger mile data for each of the 10 years within our study period. As shown in figure 1, during this period, same-agency ridership changed from 9.698 billion passengers in 2008 to 9.131 passengers in 2017, a decrease of 5.85%. While ridership declined to 9.366 billion passengers in 2010, it increased again to a high of 9.769 billion in 2014 before falling to 2017’s low.
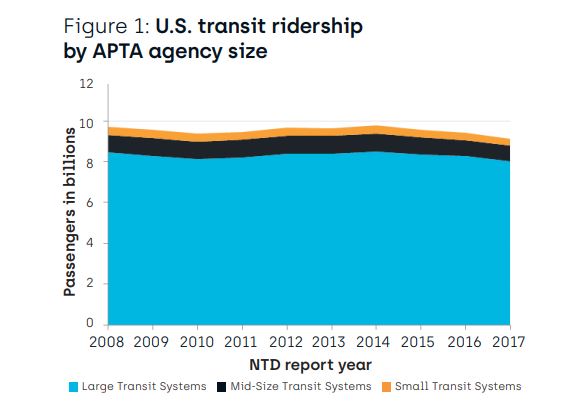
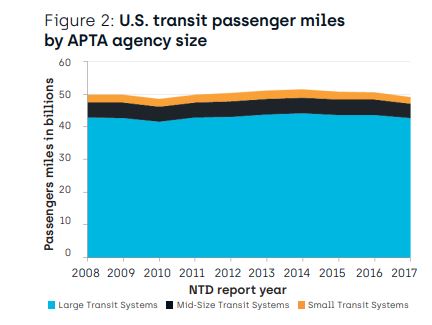
Figure 2 illustrates that the impact on the volume of passenger travel, as measured in terms of passenger miles, did not decline at the same rate. Same-agency passenger miles changed from 49.874 billion in 2008 to 49.186 billion in 2017, a decrease of only 1.38%. However, the 2017 passenger miles were not the low point during this 10-year period: in 2010 the same-agency passenger miles reached a low of 48.563 billion. As is seen in figures 1 and 2, these trends were largely consistent across the American Public Transportation Association's (APTA’s) large, mid, and small transit agency definitions, although passenger miles for mid and small transit agencies reached their lowest point in 2017, rather than in 2010 as occurred with the large systems.
What does this data reveal? As figure 3 shows, the average distance each passenger traveled, in terms of average passenger trip length, increased over the 10-year period, from 5.14 miles in 2008 to 5.39 miles in 2017.
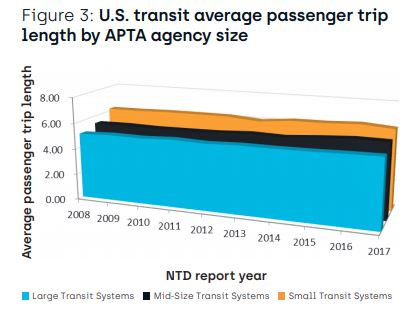
We organized this data by APTA’s transit agency size categories in terms of annual passengers: 4 million or less defined as small, 4 million-20 million defined as mid, and 20 million or more defined as large. While passenger trips did not lengthen linearly each year across the three APTA agency size groupings, the overall trend of longer trips is clear. It is also interesting to note that the small transit agencies have the longest average trip lengths, followed by mid and large agencies, respectively. Small agencies average trip length was 6.18 miles in 2008 and 6.22 miles in 2017, having reached a high of 6.4 miles in 2016. Large transit agencies average passenger trip lengths ranged from 5.07 miles in 2008 to a high of 5.31 miles in 2017. Mid-size agencies ranged from 5.43 miles in 2008 to 5.79 miles in 2017, with the shortest of 5.39 miles reported in 2010, and the longest of 5.82 miles reported in 2016.
We also reviewed this same data by transit agency mode. Here we focus on only the modes that exist on at least 15 of the same-agency systems for the 2008-2017 period as illustrated in figures 4 and 5.
Figure 4: US Transit Average Passenger Trip Length by Mode
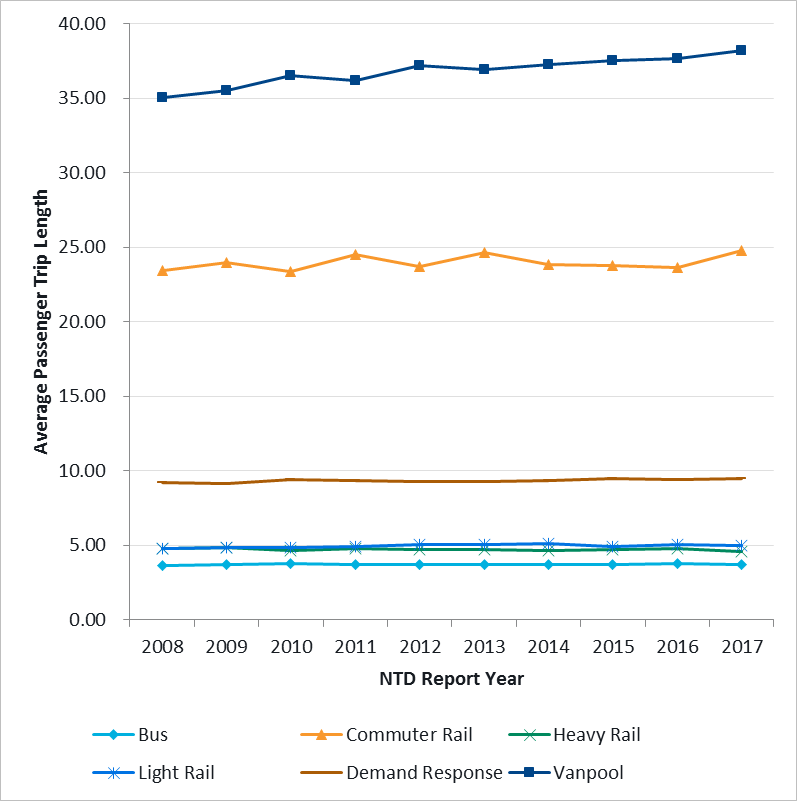
Figure 5: US Bus, Heavy Rail & Light Rail Average Passenger Trip Lengths
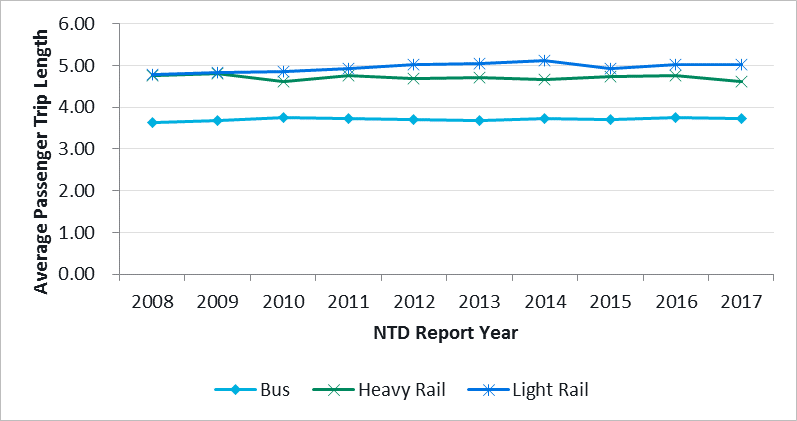
Vanpools, which have the longest reported trip lengths, experienced a 9.1% increase in average passenger trip length from 35.04 miles to 38.23 miles. Commuter rail, with the second longest reported average passenger trip lengths, experienced a 5.7% increase, from 23.42 miles in 2008 to 24.76 miles in 2017. Light rail passenger trip lengths also increased, by 4.6% from 4.79 to 5.01 miles during the 10-year period. Bus systems had the shortest average passenger trip lengths, but did lengthen 2.47% from 3.63 miles in 2008 to 3.72 miles in 2017. Heavy rail is the only mode where trip lengths shortened over the period, by 2.97% from 4.75 miles to 4.61 miles between 2008 and 2017. Also note that heavy rail had the smallest ridership decline of the modes analyzed, declining just 0.9% between 2008 and 2017.
While the specific changes experienced by each individual transit agency are likely to be unique among themselves, the overall trend of longer average passenger trips does coincide with the decline in ridership and the arrival of disruptive transportation services such as ride-hailing and bikesharing ushered in with Uber’s launch in 2009. While further research is needed to determine if these two changes are more than a coincidence, the change in passenger trip length is a factor transit systems should consider as they continue to evaluate their mix of service offerings.