Deprivation as an indicator for travelling to school trends
It has been suggested that poverty or deprivation of a local area would influence how children travel to school.

It has been suggested that poverty or deprivation of a local area would influence how children travel to school and we decided to test this hypothesis by utilising two data sources: the UK School Census and the Index of Multiple Deprivation (IMD). Both these sources are available to use without charge, and are potentially very powerful. (see inset boxes for more information).
Simple analysis of the correlation between the two variables demonstrated that there is indeed a relationship between deprivation and travel to school mode. Namely, in more deprived areas, more children walk to school, whereas in less deprived areas, more children travel to school by car. The relationship is illustrated in Figure 1, and what this shows is that while deprivation is an important influence on mode used, there are clearly some other significant influences on modal choice. In fact, for bus use deprivation is not a significant influence at all (or at least, if it is a factor it is dominated by others).
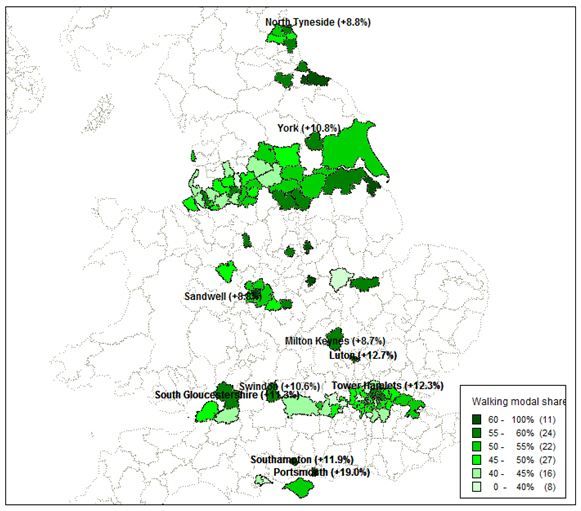
In order to try and uncover some of these influences we examined in more detail the trend between deprivation and mode share levels. Using the linear best fit lines in Figure 1, we calculated what walking mode share would be expected in each local authority area based on the level of deprivation of the area. This allowed us to identify those areas that had the greatest level of walking relative to what would be expected given the local authority’s IMD. Table 1 below shows the ten areas which had the greatest positive difference between their actual mode share from School Census data compared to what is expected. Figure 2 shows the actual walk mode share for all local authorities and highlights the location of the ten authorities, which had higher than expected walk mode shares.
Interestingly, the ten local authority areas we have identified as having an unexpectedly high walk mode share come from a variety of localities. Whilst they seem to be clustered around Greater London and the South West, they include urban areas such as York and Tower Hamlets as well as rural areas such as South Gloucestershire. What then distinguishes those areas that have higher than expected walk modal share? The data analysed here was from 2007/8 travel to school data, when many local authorities were beginning to promote school travel planning in earnest. The exceptional results in areas such as Tower Hamlets and Portsmouth may reflect these local authorities’ proactive approach to implementing school travel plans, where practically 100% of schools had travel plans by 2010. It is also likely that local geography and infrastructure have a role to play here- for instance Milton Keynes’ bespoke walking and cycling network, the Redways, may contribute to higher walk mode share in this area.
Nonetheless, clearly deprivation is an important factor to take into account when determining school travel policies and implementation. Initiatives need to bear in mind the local audience, their needs and background. The insight here is that while deprivation gives a good indication of general trends for school travel habits, that there are other factors at work also. It would certainly be interesting to see how much of the differences in mode share for school travel can be explained by including other existing data, such as the density of urban areas, the social and demographic characteristics of the area using the Output Area Classification, the bus network coverage using the PTAL Calculator, and congestion levels using iTIS data.
Figure 1: relationship between mode share for travel to school and deprivation
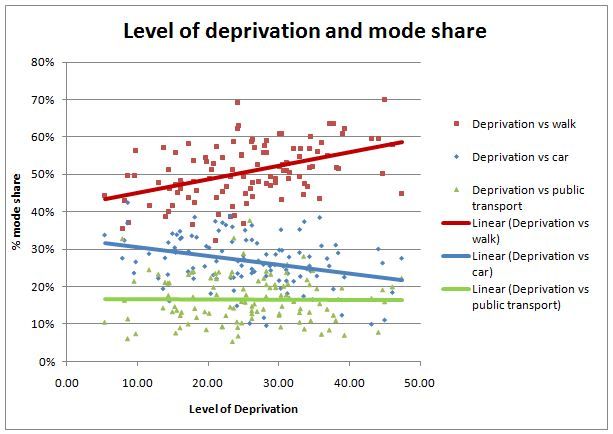
Table 1 Local Authorities who have a significantly greater actual walking mode share compared to predicted levels for their deprivation level.
|
|
Government Office Region |
Local Authority |
IMD Score– |
Actual Walking share |
Expected Walking share |
Difference |
|
1 |
South East |
Portsmouth |
24.09 |
69.2% |
50.2% |
19.0% |
|
2 |
East of England |
Luton |
24.26 |
63.0% |
50.3% |
12.7% |
|
3 |
London |
Tower Hamlets |
44.99 |
70.0% |
57.7% |
12.3% |
|
4 |
South East |
Southampton |
24.20 |
62.2% |
50.3% |
11.9% |
|
5 |
South West |
South Gloucestershire |
9.77 |
56.4% |
45.1% |
11.3% |
|
6 |
Yorkshire and the Humber |
York |
13.63 |
57.2% |
46.4% |
10.8% |
|
7 |
South West |
Swindon |
17.19 |
58.3% |
47.7% |
10.6% |
|
8 |
West Midlands |
Sandwell |
37.16 |
63.7% |
54.9% |
8.8% |
|
9 |
North East |
North Tyneside |
23.63 |
58.8% |
50.0% |
8.8% |
|
10 |
South East |
Milton Keynes |
15.43 |
55.8% |
47.1% |
8.7% |
Figure 2 Actual walking mode share by Local Authority.
More about the Index of Multiple Deprivation (IMD)
The Index of Multiple Deprivation (IMD) is a Communities and Local Government source which measures relative deprivation across the UK. The overall measure of deprivation is composed of seven ‘domains’: Income; Employment; Health Deprivation and Disability; Education, Skills and Training; Barriers to Housing and Services; Crime; and Living Environment. Every Super Output Area (SOA) has an overall index value and one for each of these domains. The most recent data is for 2010 though the analysis here uses 2007 data in order to be consistent with that used for the mode to school.
More about the School Census
The school census takes place each term amongst all maintained schools. Included within the information on pupils collected is usual mode to school and home postcode. This information is used for National Indicator 198 and collected by the Department for Education. The data for this analysis was taken from National Indicator 198, 2007-2008 School Travel Statistics in the Department for Transport database.