Bus ridership 2024-25: How do different combined authorities fare across the UK?
New DfT data shows bus use edging upward but still trailing far behind pre-pandemic levels. With funding rising and the Bus Services Act reshaping local powers, the question now is whether targeted infrastructure, smarter investment and empowered authorities can reverse long-term decline, and where in the UK momentum is already building.
Today, the Department for Transport (DfT) announced £3 billion multi-year funding to English local authorities to support “better buses.”
The DfT has released figures on bus ridership for the year 2024–25, showing a slight rise in ridership. There is a clear slowdown in the post-COVID recovery of passenger numbers, and it is worth noting that 15% fewer trips were made than in 2018-19. This reduction is broadly in line with the annual trends over the past twelve years.
The figures come at a time when the UK Government is heavily focused on increasing and improving bus services, referring to buses as the ‘lifeblood of communities’. Meanwhile, the Bus Services Act was passed in October and promises to empower local authorities on bus interventions. This continues the investment in previous years through Bus Service Improvement Plans and support for the purchase of zero-emission buses.
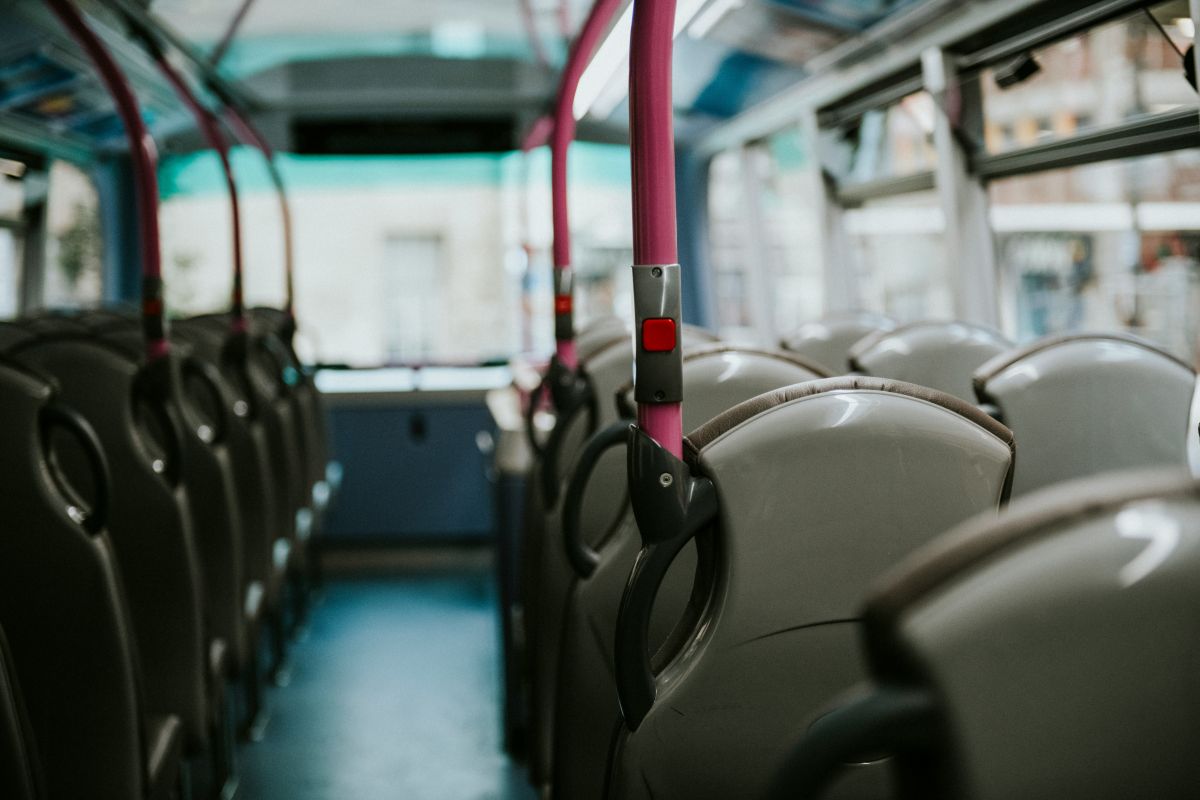
Buses are the most used form of public transport, but long-term trends show a reduction in passenger numbers and services. Whether or not new legislation can turn this around, not least in order to help meet Net Zero commitments, remains to be seen. It’s essential that buses are viewed as local services and detailed decisions are best made using the skills and funding of both local authorities and bus operators.
While government policy and the new Bus Services Act are rightly focused on empowering local authorities and improving services, the challenge of rising operating costs continues to threaten service levels and network coverage.
To reverse long-term decline and deliver real value, investment must go beyond service levels and focus on efficiency—specifically, by prioritising bus infrastructure. Well-designed bus priority measures and targeted infrastructure schemes can dramatically improve journey times and reliability, allowing operators to make better use of their resources and deliver “more for less.” This focus, alongside continued investment in zero-emission fleets, can stabilise rising operating costs and protect bus services.
In the year in question, the English maximum single fare rose from £2 to £3 in quarter 4. Some combined authorities held the maximum below £3. The final tranche of Manchester franchised services also started in quarter 4. Both aspects will only be partially reflected in the full year’s figures. The bus fare cap does not apply in London, Scotland or Wales.
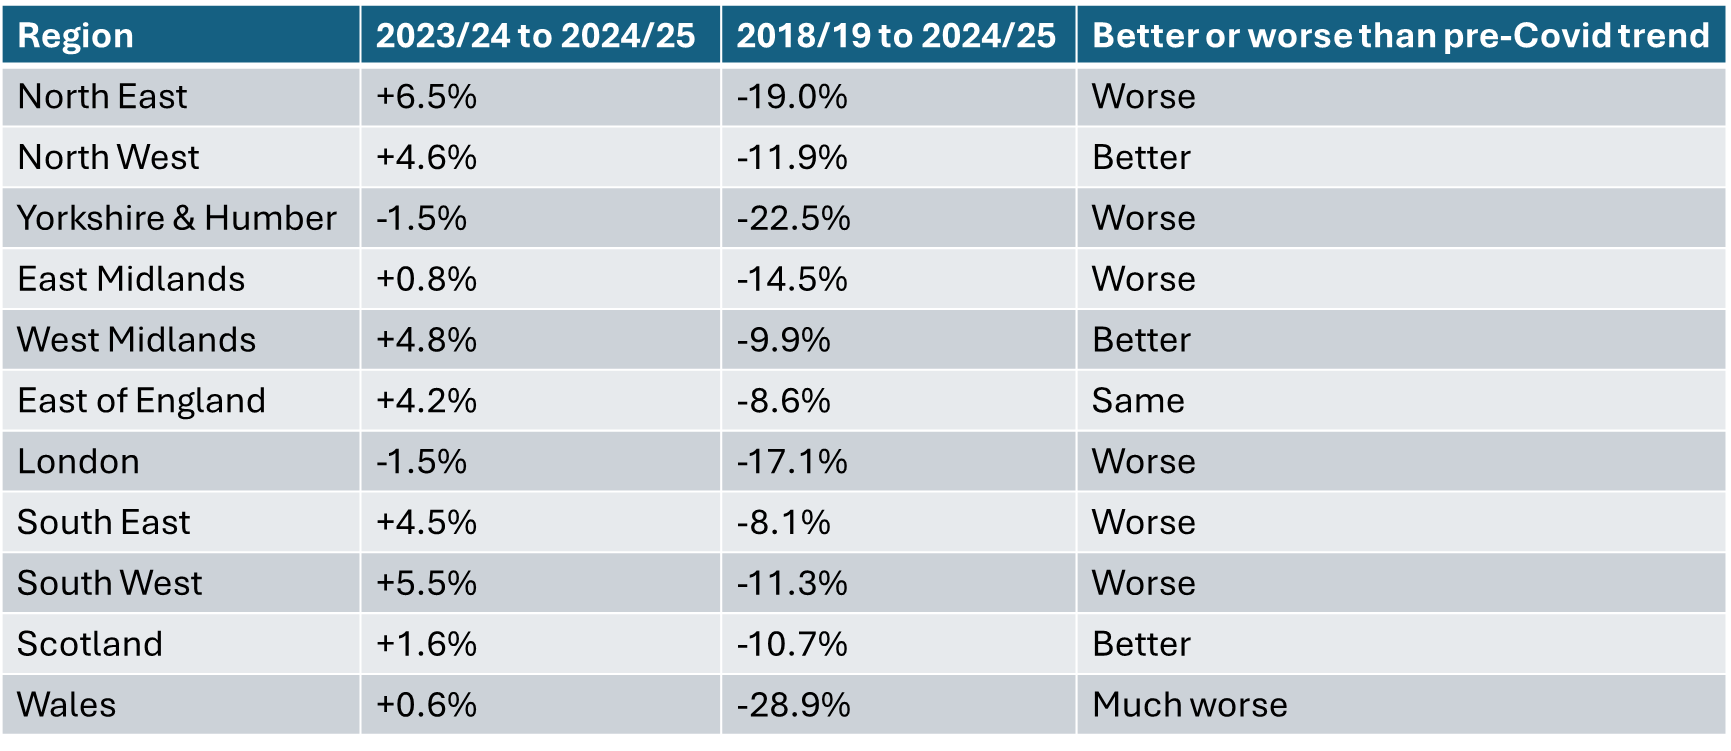
Regional breakdown of bus ridership stats
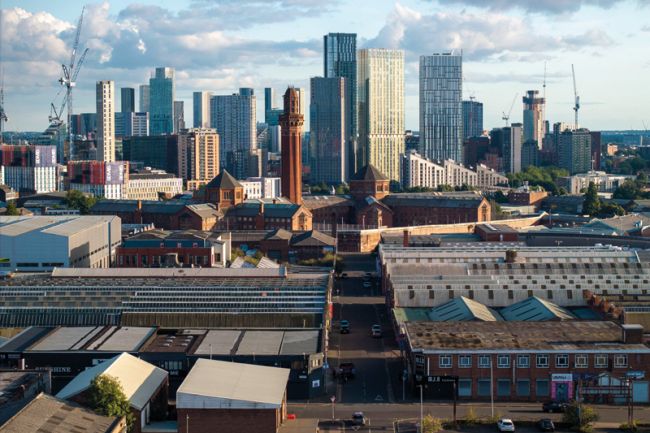
The North West, West Midlands and Scotland are the only regions performing better than the pre-COVID trend, with Wales performing the worst against that curve. Scottish results are influenced by the country’s scheme, which gives free bus travel to everyone between 5 and 21 years old. In the North West, both Merseyside and Greater Manchester combined authorities have held the maximum fare below £3.
Bus patronage in Wales has collapsed since the pandemic and is running around 30% below pre-COVID levels.
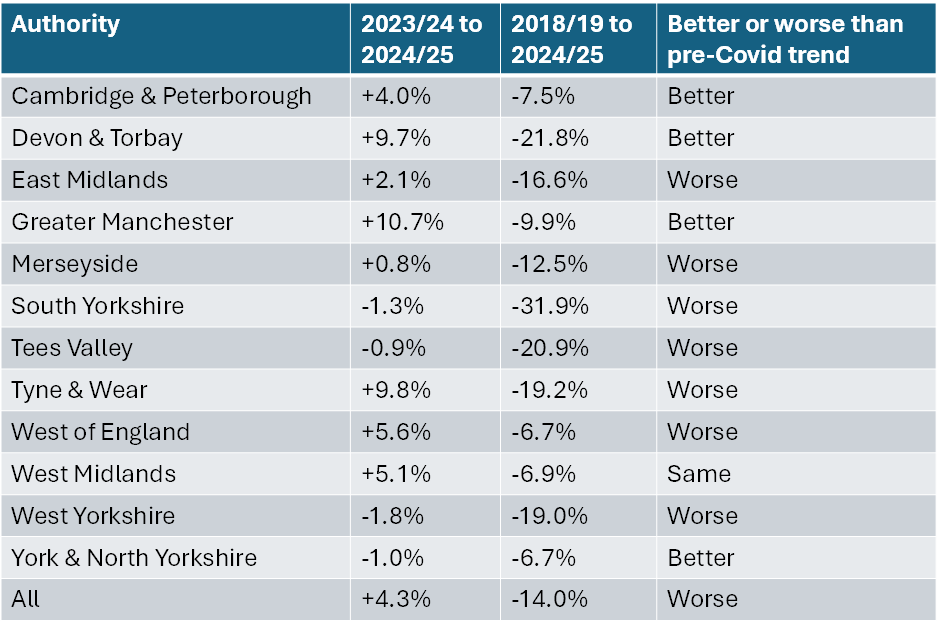
A breakdown by combined authority shows Greater Manchester achieving the greatest annual increases in demand, and one of the combined authorities performing better than the pre-COVID trend. Franchising may well be part of the reason, though fare capping and the strength of the area’s economy will also be having an effect. Next year’s figures will include a full year of franchising over the whole of Greater Manchester, so they should give a clearer picture. The DfT figures do not provide details on the cost and revenue effects.
Revenue and operating costs
Meanwhile, operating costs for services have increased in real terms since 2018-19. This reflects internal industry cost pressures on wages and fuel. There are no revenue figures for 2024-25, but flat performance in prior years would suggest that operating margins are getting tighter.
Bus miles have risen by 2.4% in the past year. Some of this rise will be linked to Bus Service Improvement Plan changes coming through, whilst other rises are linked to growing demand in some areas. to 1.24 billion, showing a reduction of 13.2% since 2018-2019, a flat trend since post-COVID reductions outside of London.
Operating costs per mile have risen 18% since 2018-19.
Revenue was £6.3 billion in 2024, a 4.1% annual increase but a reduction of 9.2% since 2018-2019. 51% of this was from passenger revenue, with 49% from public support.
It is clear that the areas of the country with the highest levels of bus use are those where there is an effective partnership between local authorities and bus operators, enabling the use of public funds to the best effect in achieving higher bus use and reduced traffic congestion/pollution.
Steer has a considerable history in supporting local authorities achieve their transport and wider policy goals within the deregulated bus environment and in considering and implementing regulatory change to adjust the balance between private and public sector control of bus services.
If you’d like to know how Steer can help across business cases, networks, and the role of buses in mass transit, get in touch.